How quickly are EVs taking off?
Electric vehicles or EVs can take a long time to gain a foothold in a given country, but in general once sales reach around 10% of the total sales in a given year, they quickly take off and can dominate within a matter of 3-4 years. This has already happened in some European countries. As of the end of 2022, 88% of new car sales in Norway were battery electric vehicles, along with 70% in Iceland, 54% in Sweden, 38% in Denmark, and 37% in Finland. In terms of absolute numbers, China leads the pack, with 5.9 million new electric cars sold in 2022 (compare that to percentage leader Norway’s tiny 153,144 electric cars).
Electric car sales statistics are available from different sources for each country. For the above figures and for worldwide figures generally, a handy Wikipedia article Electric car use by country lists total sales by country and region as well as percentage of electric car sales.
Electric car sales statistics for Canada
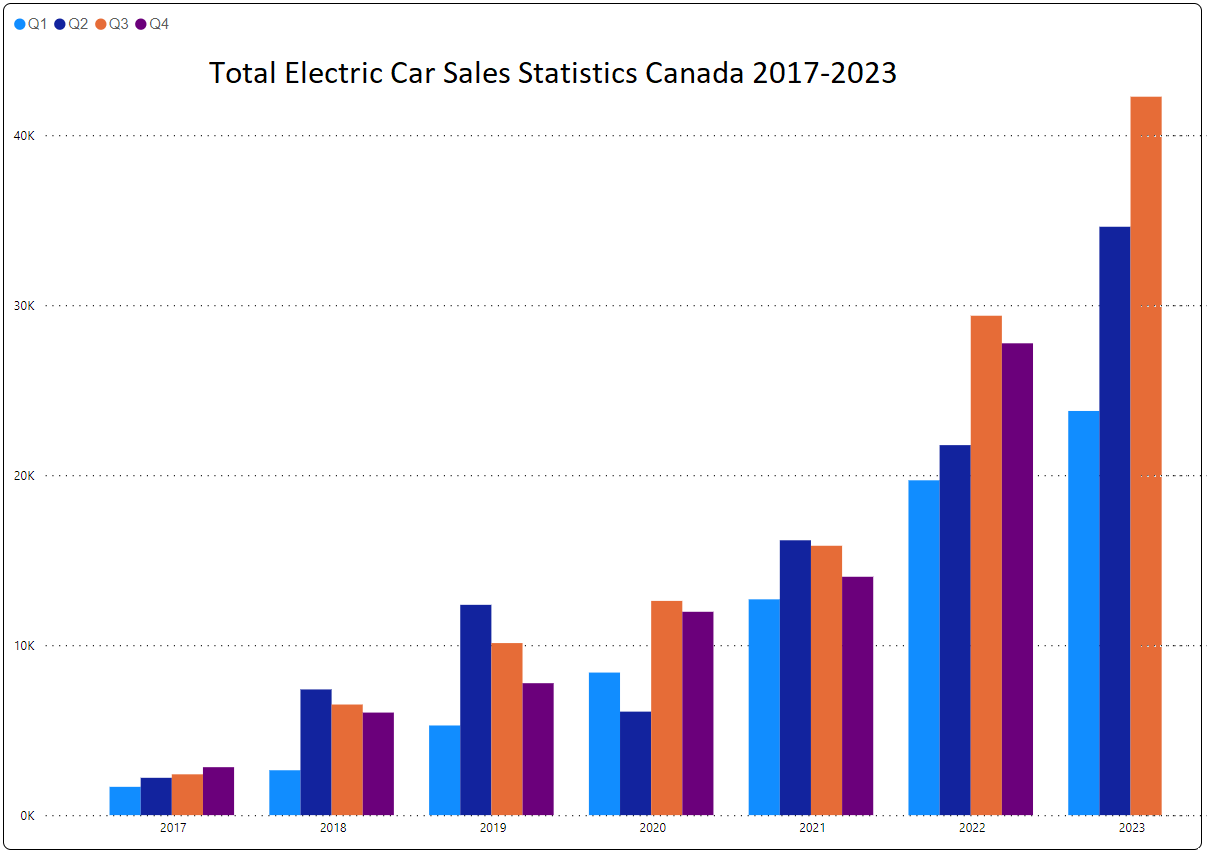
Electric car sales statistics from Canada are available from the StatsCan website. The New Motor Vehicle Registration Survey provides detailed information on total car registrations and registrations in each of Gasoline, Diesel, Hybrid, Plug-in Hybrid, and Battery Electric (Note – if this link does not work for you, try this search link). The following chart shows electric car sales statistics for Canada as of the end of Q3 of 2023 (i.e. up to the end of September 2023). As you can see, sales are accelerating quite nicely with the last quarter pushing above the 40,000 units mark for the first time. As a percentage of total car sales, electric car sales are at 9.2% at the end of Q3. So we’re not that far from hitting that important 10% threshold after which electric car sales should start taking off.

In terms of sales by region, Quebec, Ontario and BC lead the pack, with BC at the top with 17,101 electric car sales in Q3 2023, Ontario with 11,355 and Quebec with 10,810. The share of BEVs is Quebec 19.1%, BC 15.1%, and Ontario 9.2%. The reason Quebec and BC lead the pack on percentage is due to the generous provincial subsidy available for EV purchase in BC and Quebec, which adds to the $5000 subsidy offered by the Federal government. Ontario axed the benefit when Doug Ford’s government took power, but Ontario still sells more EVs than Quebec because it just sells more vehicles.
Electric car sales statistics for the United States
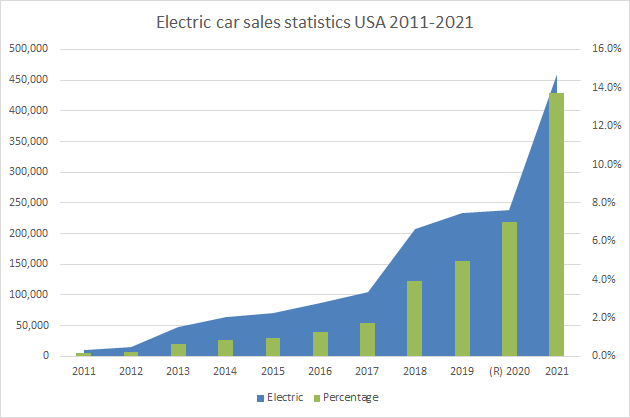
I found several US government sources for electric car sales statistics in the US. The Bureau of Transportation Statistics (bts.gov) provides retail new passenger car sales as well as hybrid-electric, plug-in hybrid-electric and electric vehicle sales. These statistics provide year-over-year numbers starting decades ago (but for the purposes of electric car sales statistics the starting year is 2011, when 10,092 battery electric cars were sold). They point to total battery electric vehicle sales hitting 459,426 in 2021. Meanwhile, the Alternative Fuels Data Center (afdc.gov) provides vehicle registrations by state statistic, which covers total vehicle active registrations, as opposed to new vehicle registrations. According to these, the total battery electric vehicles currently registered was 2.442 million which means over 20% of total electric vehicles on the road in 2022 were sold in 2022 – indicating rapid uptake of electric vehicles. The chart below shows US electric car sales over time, and you can see both the raw number and the percentage of total sales increasing nicely. As of 2021, according to the Bureau of Transportation Statistics, we hit 13.7% of new car sales as BEV sales, which is well above the 10% threshold.

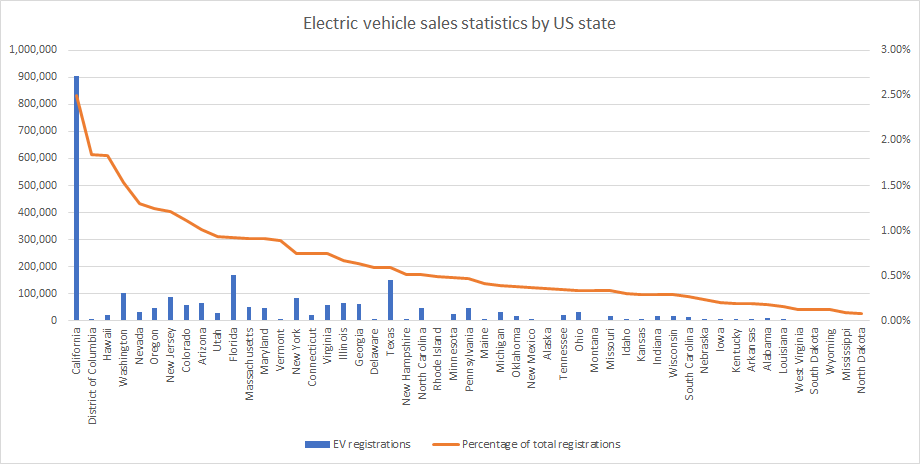
In terms of registrations by state, the leader by far is California, both in terms of number (903,600) and percentage (2.5%) of total vehicles registered. The number makes sense just in terms of California’s population, while the percentage makes sense given generous subsidies for EVs in that state.

Looking at new car registrations, I took the top few states in terms of total registered EVs and pulled state-based data for them for new EV registrations:
- California, 2022: 16% battery electric
- Florida, 1Q 2022, 4.5% electric (may include BEV and PHEV)
- Texas, 2022: 4.3% electric
- Washington, 1H 2023: 18% electric
- New Jersey, 2022: 9.8% electric (light duty only)
Some notes on these electric car sales statistics:
Electric vs. battery electric: Most organizations/companies that provide EV statistics include both battery electric vehicles and plug-in hybrid electric vehicles. In the statistics I’ve quoted/charted above, except where otherwise stated, I am only counting battery electric vehicles. I consider plug-in hybrid EVs to not pass the bar of being an EV because they also run on gas, and therefore emit CO2, and also because it turns out that in real life, drivers use far more gas in PHEVs than they think they will (or than the EPA estimates they will). Automated trackers deployed in PHEVs have shown that the percentage of miles travelled on battery can be as low as 5% of the total. My recommendation to anyone thinking of transitioning from a gas powered car to an electric car is, go straight to BEV. You’re really just buying a more expensive gas car if you go for a PHEV – unless you’re super careful to keep it charged.
Light duty only: Different local jurisdictions provide registration data for all passenger vehicles, or for light-duty only. Figures denote all passenger vehicles except where otherwise noted.
Sources: States other than California don’t provide detailed regularly updated electric car sales statistics so I did individual searches of government websites, news articles, and industry publications to obtain the state percentages for new EV registrations. These numbers are for general information only and I cannot guarantee their accuracy.

Leave a Reply
Want to join the discussion?Feel free to contribute!